Daten & ROI
Live-Ausgabe der echten Render-Engine — ändere die Einstellungen und sie aktualisiert sich sofort.
Korrelationsmatrix
gestaltete motion-karten
Eine Heatmap-Matrix aller Variablenpaare, die sich Zelle für Zelle auf einer divergierenden Farbskala füllt und dann mit Callout und Legende auf den stärksten Zusammenhang fokussiert.
Ideal für: Analytics-Erkenntnisse, Forschungsergebnisse und was eine Kennzahl antreibt.
Einstellungen
Schrift
Theme
Größe
Stimmung
Formate, die die Bildprüfung bestanden haben
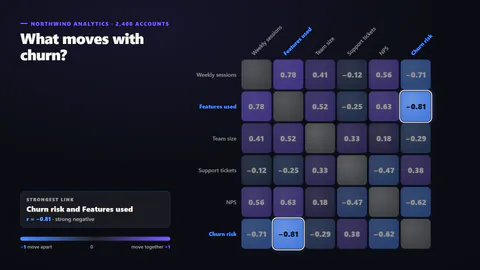
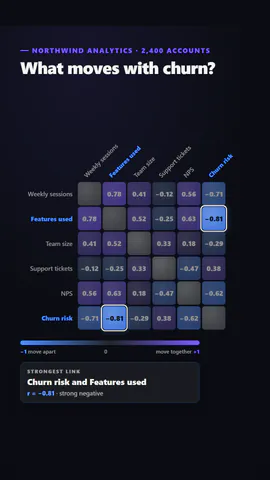
1:1
Was du schreibst
titleTitle (≤60)· PflichtvariablesThe variables, in the order of the matrix rows and columns (≤18)· PflichtkickerSmall line above the title (≤40)shapeFull: every pair twice, mirrored; triangle: each pair once, labels on the diagonalcellsSquares filled by colour, or circles sized by strengthshowValuesPrint the coefficient in each cell when there is room
Eine Code-Vorlage: in jedem Tarif kostenlos, ohne KI-Credits.
In einem Film verwenden
Gemacht fürZahlen & Ergebnisse
Was du ändern kannst:
rushie.props.titlerushie.props.variablesrushie.props (others)Für Entwickler (MCP und JSON)
Das ist genau die Szene für create_animation (MCP): Struktur behalten, Worte ändern und den Sprechertext schreiben — die Stimme bestimmt, wie lange die Szene dauert. Mit set_data in update_storyboard einfügen, um einen fertigen Film zu ändern.
{
  "visual": "rushie",
  "heading": "Correlation matrix",
  "narration": "Write the sentence the voice says over this scene; its length is the scene's.",
  "data": {
    "rushie": {
      "template": "correlation-matrix",
      "props": {
        "kicker": "Northwind analytics · 2,400 accounts",
        "title": "What moves with churn?",
        "variables": [
          "Weekly sessions",
          "Features used",
          "Team size",
          "Support tickets",
          "NPS",
          "Churn risk"
        ],
        "matrix": [
          [
            1
          ],
          [
            0.78,
            1
          ],
          [
            0.41,
            0.52,
            1
          ],
          [
            -0.12,
            -0.25,
            0.33,
            1
          ],
          [
            0.56,
            0.63,
            0.18,
            -0.47,
            1
          ],
          [
            -0.71,
            -0.81,
            -0.29,
            0.38,
            -0.62,
            1
          ]
        ],
        "shape": "full",
        "cells": "squares",
        "showValues": true,
        "negativeColor": "#4f8dff"
      }
    }
  }
}