Daten & ROI
Live-Ausgabe der echten Render-Engine — ändere die Einstellungen und sie aktualisiert sich sofort.
Kohorten-Retention
gestaltete motion-karten
Ein Kohorten-Retention-Dreieck, das sich Zeile für Zeile (oder Periode für Periode) einfärbt, jede Zelle mit ihrem Prozentwert, mit Durchschnittszeile und einem Callout, das alte und neue Kohorten vergleicht.
Ideal für: Retention-Reviews, Product-Market-Fit und Wachstums-Updates.
Einstellungen
Schrift
Theme
Größe
Stimmung
Formate, die die Bildprüfung bestanden haben
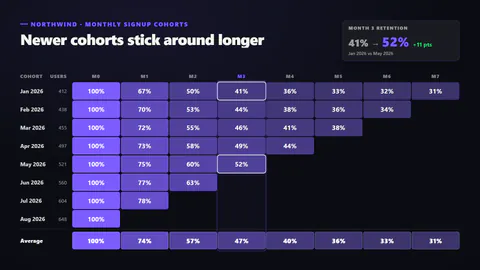
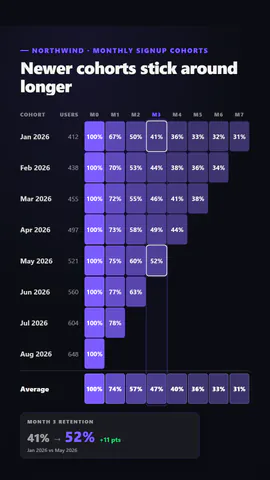
1:1
Was du schreibst
titleTitle (≤60)· PflichtcohortsCohorts from oldest to newest, each with its size and retention by period· PflichtperiodNameThe period in words, for the callout (≤10)· PflichtkickerSmall line above the title (≤40)periodLabelShort prefix for the period columns, like M or W (≤3)paletteAccent: deeper accent for higher retention; heat: red to amber to greenrevealRows: each cohort colours in turn; columns: period by period down the tableshowValuesPrint the percentage in each cell
Eine Code-Vorlage: in jedem Tarif kostenlos, ohne KI-Credits.
In einem Film verwenden
Gemacht fürZahlen & Ergebnisse
Was du ändern kannst:
rushie.props.titlerushie.props.cohortsrushie.props.periodNamerushie.props (others)Für Entwickler (MCP und JSON)
Das ist genau die Szene für create_animation (MCP): Struktur behalten, Worte ändern und den Sprechertext schreiben — die Stimme bestimmt, wie lange die Szene dauert. Mit set_data in update_storyboard einfügen, um einen fertigen Film zu ändern.
{
  "visual": "rushie",
  "heading": "Cohort retention",
  "narration": "Write the sentence the voice says over this scene; its length is the scene's.",
  "data": {
    "rushie": {
      "template": "cohort-retention",
      "props": {
        "kicker": "Northwind · monthly signup cohorts",
        "title": "Newer cohorts stick around longer",
        "cohorts": [
          {
            "label": "Jan 2026",
            "size": 412,
            "retention": [
              100,
              67,
              50,
              41,
              36,
              33,
              32,
              31
            ]
          },
          {
            "label": "Feb 2026",
            "size": 438,
            "retention": [
              100,
              70,
              53,
              44,
              38,
              36,
              34
            ]
          },
          {
            "label": "Mar 2026",
            "size": 455,
            "retention": [
              100,
              72,
              55,
              46,
              41,
              38
            ]
          },
          {
            "label": "Apr 2026",
            "size": 497,
            "retention": [
              100,
              73,
              58,
              49,
              44
            ]
          },
          {
            "label": "May 2026",
            "size": 521,
            "retention": [
              100,
              75,
              60,
              52
            ]
          },
          {
            "label": "Jun 2026",
            "size": 560,
            "retention": [
              100,
              77,
              63
            ]
          },
          {
            "label": "Jul 2026",
            "size": 604,
            "retention": [
              100,
              78
            ]
          },
          {
            "label": "Aug 2026",
            "size": 648,
            "retention": [
              100
            ]
          }
        ],
        "periodLabel": "M",
        "periodName": "Month",
        "palette": "accent",
        "reveal": "rows",
        "showValues": true
      }
    }
  }
}