Daten & ROI
Live-Ausgabe der echten Render-Engine — ändere die Einstellungen und sie aktualisiert sich sofort.
Treemap-Diagramm
gestaltete motion-karten
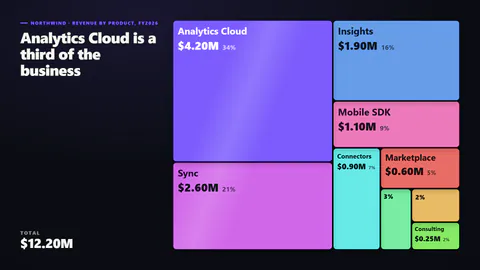
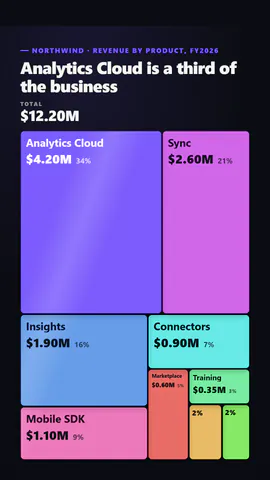
Ein Block, der sich immer wieder in Rechtecke nach Wert teilt, jedes mit Betrag und Anteil beschriftet, unter einer hochzählenden Gesamtsumme.
Ideal für: Umsatzmix, Budgetanteile, Marktanteile und Portfolio-Aufschlüsselungen.
Einstellungen
Schrift
Theme
Größe
Stimmung
Formate, die die Bildprüfung bestanden haben
1:1
Was du schreibst
titleTitle (≤60)· PflichtitemsThe parts, each a label and a value; areas are drawn in proportion· PflichtkickerSmall line above the title (≤40)prefixBefore each value, like $ (≤3)suffixAfter each value, like M or % (≤4)decimalsDecimal places (≤2)paletteSpectrum: a family of hues around the accent; accent: shades of the accent, brightest for the largestrevealSplit: one block divides again and again by value; grow: tiles pop in from largest to smallest
Eine Code-Vorlage: in jedem Tarif kostenlos, ohne KI-Credits.
In einem Film verwenden
Gemacht fürZahlen & Ergebnisse
Was du ändern kannst:
rushie.props.titlerushie.props.itemsrushie.props (others)Für Entwickler (MCP und JSON)
Das ist genau die Szene für create_animation (MCP): Struktur behalten, Worte ändern und den Sprechertext schreiben — die Stimme bestimmt, wie lange die Szene dauert. Mit set_data in update_storyboard einfügen, um einen fertigen Film zu ändern.
{
  "visual": "rushie",
  "heading": "Treemap",
  "narration": "Write the sentence the voice says over this scene; its length is the scene's.",
  "data": {
    "rushie": {
      "template": "treemap",
      "props": {
        "kicker": "Northwind · revenue by product, FY2026",
        "title": "Analytics Cloud is a third of the business",
        "items": [
          {
            "label": "Analytics Cloud",
            "value": 4.2
          },
          {
            "label": "Sync",
            "value": 2.6
          },
          {
            "label": "Insights",
            "value": 1.9
          },
          {
            "label": "Mobile SDK",
            "value": 1.1
          },
          {
            "label": "Connectors",
            "value": 0.9
          },
          {
            "label": "Marketplace",
            "value": 0.6
          },
          {
            "label": "Training",
            "value": 0.35
          },
          {
            "label": "Support plans",
            "value": 0.3
          },
          {
            "label": "Consulting",
            "value": 0.25
          }
        ],
        "prefix": "$",
        "suffix": "M",
        "decimals": 2,
        "palette": "spectrum",
        "reveal": "split"
      }
    }
  }
}