Daten & ROI
Live-Ausgabe der echten Render-Engine — ändere die Einstellungen und sie aktualisiert sich sofort.
Hexagon-Regionenkarte
gestaltete motion-karten
Regionen als abstrakte Hexagon-Kachelkarte, die sich wellenartig aufbaut und dann Kachel für Kachel vom niedrigsten bis zum höchsten Wert einfärbt, mit gestufter Legende und hervorgehobener Top-Region.
Ideal für: Vertriebsgebiete, Regionalergebnisse und Abdeckung.
Einstellungen
Schrift
Theme
Größe
Stimmung
Formate, die die Bildprüfung bestanden haben
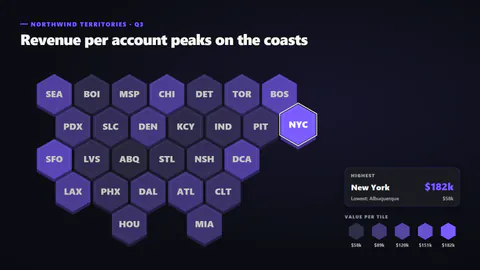
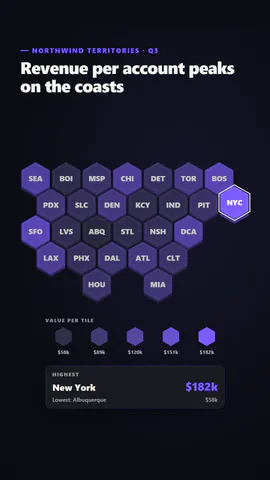
1:1
Was du schreibst
titleTitle (≤60)· PflichtregionsThe regions: a short code, a name and a value, with an optional grid position· PflichtkickerSmall line above the title (≤40)prefixBefore each value, like $ (≤3)suffixAfter each value, like % or k (≤4)decimalsDecimal places (≤2)scaleSequential: one colour deepening with value; diverging: two colours either side of the midpointmidpointThe value that is neutral on a diverging scale (≤1000000000000)labelsTiles show their code, or their code and value
Eine Code-Vorlage: in jedem Tarif kostenlos, ohne KI-Credits.
In einem Film verwenden
Gemacht fürZahlen & Ergebnisse
Was du ändern kannst:
rushie.props.titlerushie.props.regionsrushie.props (others)Für Entwickler (MCP und JSON)
Das ist genau die Szene für create_animation (MCP): Struktur behalten, Worte ändern und den Sprechertext schreiben — die Stimme bestimmt, wie lange die Szene dauert. Mit set_data in update_storyboard einfügen, um einen fertigen Film zu ändern.
{
  "visual": "rushie",
  "heading": "Hexagon region map",
  "narration": "Write the sentence the voice says over this scene; its length is the scene's.",
  "data": {
    "rushie": {
      "template": "hex-region-map",
      "props": {
        "kicker": "Northwind territories · Q3",
        "title": "Revenue per account peaks on the coasts",
        "regions": [
          {
            "code": "SEA",
            "name": "Seattle",
            "value": 149,
            "col": 0,
            "row": 0
          },
          {
            "code": "BOI",
            "name": "Boise",
            "value": 72,
            "col": 1,
            "row": 0
          },
          {
            "code": "MSP",
            "name": "Minneapolis",
            "value": 96,
            "col": 2,
            "row": 0
          },
          {
            "code": "CHI",
            "name": "Chicago",
            "value": 138,
            "col": 3,
            "row": 0
          },
          {
            "code": "DET",
            "name": "Detroit",
            "value": 88,
            "col": 4,
            "row": 0
          },
          {
            "code": "TOR",
            "name": "Toronto",
            "value": 121,
            "col": 5,
            "row": 0
          },
          {
            "code": "BOS",
            "name": "Boston",
            "value": 164,
            "col": 6,
            "row": 0
          },
          {
            "code": "PDX",
            "name": "Portland",
            "value": 112,
            "col": 0,
            "row": 1
          },
          {
            "code": "SLC",
            "name": "Salt Lake City",
            "value": 84,
            "col": 1,
            "row": 1
          },
          {
            "code": "DEN",
            "name": "Denver",
            "value": 118,
            "col": 2,
            "row": 1
          },
          {
            "code": "KCY",
            "name": "Kansas City",
            "value": 69,
            "col": 3,
            "row": 1
          },
          {
            "code": "IND",
            "name": "Indianapolis",
            "value": 74,
            "col": 4,
            "row": 1
          },
          {
            "code": "PIT",
            "name": "Pittsburgh",
            "value": 92,
            "col": 5,
            "row": 1
          },
          {
            "code": "NYC",
            "name": "New York",
            "value": 182,
            "col": 6,
            "row": 1
          },
          {
            "code": "SFO",
            "name": "San Francisco",
            "value": 171,
            "col": 0,
            "row": 2
          },
          {
            "code": "LVS",
            "name": "Las Vegas",
            "value": 77,
            "col": 1,
            "row": 2
          },
          {
            "code": "ABQ",
            "name": "Albuquerque",
            "value": 58,
            "col": 2,
            "row": 2
          },
          {
            "code": "STL",
            "name": "St. Louis",
            "value": 71,
            "col": 3,
            "row": 2
          },
          {
            "code": "NSH",
            "name": "Nashville",
            "value": 83,
            "col": 4,
            "row": 2
          },
          {
            "code": "DCA",
            "name": "Washington DC",
            "value": 146,
            "col": 5,
            "row": 2
          },
          {
            "code": "LAX",
            "name": "Los Angeles",
            "value": 139,
            "col": 0,
            "row": 3
          },
          {
            "code": "PHX",
            "name": "Phoenix",
            "value": 86,
            "col": 1,
            "row": 3
          },
          {
            "code": "DAL",
            "name": "Dallas",
            "value": 104,
            "col": 2,
            "row": 3
          },
          {
            "code": "ATL",
            "name": "Atlanta",
            "value": 115,
            "col": 3,
            "row": 3
          },
          {
            "code": "CLT",
            "name": "Charlotte",
            "value": 97,
            "col": 4,
            "row": 3
          },
          {
            "code": "HOU",
            "name": "Houston",
            "value": 99,
            "col": 2,
            "row": 4
          },
          {
            "code": "MIA",
            "name": "Miami",
            "value": 108,
            "col": 4,
            "row": 4
          }
        ],
        "prefix": "$",
        "suffix": "k",
        "decimals": 0,
        "scale": "sequential",
        "midpoint": 100,
        "labels": "codes",
        "lowColor": "#5b8cff"
      }
    }
  }
}