Daten & ROI
Live-Ausgabe der echten Render-Engine — ändere die Einstellungen und sie aktualisiert sich sofort.
Prognose mit Konfidenzband
gestaltete motion-karten
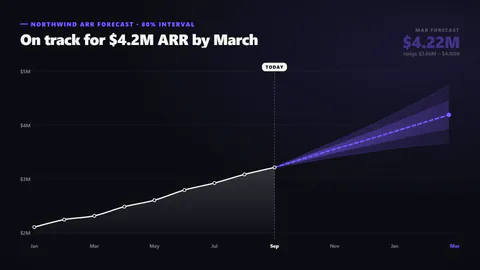
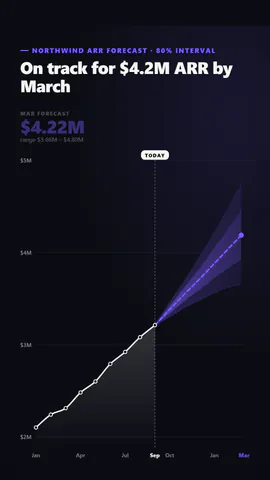
Eine Linie der Ist-Werte zeichnet sich bis zu einer Today-Markierung und läuft dann als gestrichelte Prognose in einem mit der Zeit breiter werdenden Konfidenzband weiter, am Ende steht der Prognosewert mit seiner Spanne.
Ideal für: Umsatzprognosen, Projektionen und Planung.
Einstellungen
Schrift
Theme
Größe
Stimmung
Formate, die die Bildprüfung bestanden haben
1:1
Was du schreibst
titleTitle (≤60)· PflichtactualsWhat actually happened, in order· PflichtforecastThe forecast after the last actual: the expected value and the low and high ends of its range· PflichtkickerSmall line above the title (≤40)prefixBefore each value, like $ (≤3)suffixAfter each value, like M or % (≤4)decimalsDecimal places (≤2)todayLabelThe tag on the line between actuals and forecast (≤14)bandFan: an inner likely band inside the full range; single: one bandcurveSmooth curves or straight segments
Eine Code-Vorlage: in jedem Tarif kostenlos, ohne KI-Credits.
In einem Film verwenden
Was du ändern kannst:
rushie.props.titlerushie.props.actualsrushie.props.forecastrushie.props (others)Für Entwickler (MCP und JSON)
Das ist genau die Szene für create_animation (MCP): Struktur behalten, Worte ändern und den Sprechertext schreiben — die Stimme bestimmt, wie lange die Szene dauert. Mit set_data in update_storyboard einfügen, um einen fertigen Film zu ändern.
{
  "visual": "rushie",
  "heading": "Forecast with confidence band",
  "narration": "Write the sentence the voice says over this scene; its length is the scene's.",
  "data": {
    "rushie": {
      "template": "forecast-band",
      "props": {
        "kicker": "Northwind ARR forecast · 80% interval",
        "title": "On track for $4.2M ARR by March",
        "actuals": [
          {
            "label": "Jan",
            "value": 2.1
          },
          {
            "label": "Feb",
            "value": 2.24
          },
          {
            "label": "Mar",
            "value": 2.31
          },
          {
            "label": "Apr",
            "value": 2.48
          },
          {
            "label": "May",
            "value": 2.6
          },
          {
            "label": "Jun",
            "value": 2.79
          },
          {
            "label": "Jul",
            "value": 2.92
          },
          {
            "label": "Aug",
            "value": 3.08
          },
          {
            "label": "Sep",
            "value": 3.21
          }
        ],
        "forecast": [
          {
            "label": "Oct",
            "value": 3.38,
            "low": 3.3,
            "high": 3.46
          },
          {
            "label": "Nov",
            "value": 3.55,
            "low": 3.4,
            "high": 3.7
          },
          {
            "label": "Dec",
            "value": 3.71,
            "low": 3.48,
            "high": 3.95
          },
          {
            "label": "Jan",
            "value": 3.88,
            "low": 3.56,
            "high": 4.22
          },
          {
            "label": "Feb",
            "value": 4.05,
            "low": 3.62,
            "high": 4.5
          },
          {
            "label": "Mar",
            "value": 4.22,
            "low": 3.66,
            "high": 4.8
          }
        ],
        "prefix": "$",
        "suffix": "M",
        "decimals": 2,
        "todayLabel": "Today",
        "band": "fan",
        "curve": "smooth"
      }
    }
  }
}