Datos y ROI
Salida en vivo del motor de render real — edita los ajustes y se actualiza al instante.
Retención por cohortes
tarjetas animadas de diseño
Un triángulo de retención por cohortes que se colorea fila a fila (o periodo a periodo), cada celda con su porcentaje, con una fila de media y un llamado que compara cohortes antiguas y nuevas.
Ideal para: revisiones de retención, product-market fit y novedades de crecimiento.
Ajustes
Fuente
Tema
Tamaño
Ánimo
Formatos que pasaron el control de imagen
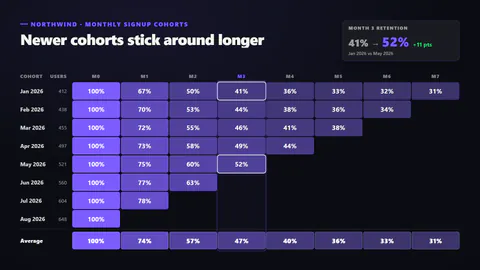
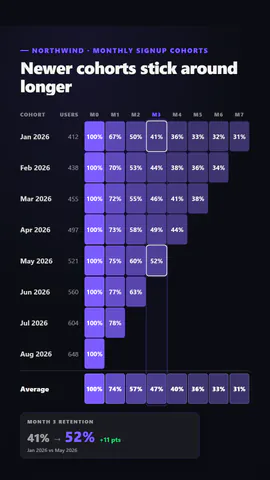
1:1
Lo que escribes
titleTitle (≤60)· obligatoriocohortsCohorts from oldest to newest, each with its size and retention by period· obligatorioperiodNameThe period in words, for the callout (≤10)· obligatoriokickerSmall line above the title (≤40)periodLabelShort prefix for the period columns, like M or W (≤3)paletteAccent: deeper accent for higher retention; heat: red to amber to greenrevealRows: each cohort colours in turn; columns: period by period down the tableshowValuesPrint the percentage in each cell
Una plantilla en código: gratis en todos los planes, sin créditos de IA.
Úsala en un vídeo
Ideal paraCifras y resultados
Lo que puedes cambiar:
rushie.props.titlerushie.props.cohortsrushie.props.periodNamerushie.props (others)Para desarrolladores (MCP y JSON)
Esta es la escena exacta para enviar a create_animation (MCP): mantén la estructura, cambia las palabras y escribe la narración — la voz fija cuánto dura la escena. Pégala en update_storyboard con set_data para cambiar un vídeo que ya hiciste.
{
  "visual": "rushie",
  "heading": "Cohort retention",
  "narration": "Write the sentence the voice says over this scene; its length is the scene's.",
  "data": {
    "rushie": {
      "template": "cohort-retention",
      "props": {
        "kicker": "Northwind · monthly signup cohorts",
        "title": "Newer cohorts stick around longer",
        "cohorts": [
          {
            "label": "Jan 2026",
            "size": 412,
            "retention": [
              100,
              67,
              50,
              41,
              36,
              33,
              32,
              31
            ]
          },
          {
            "label": "Feb 2026",
            "size": 438,
            "retention": [
              100,
              70,
              53,
              44,
              38,
              36,
              34
            ]
          },
          {
            "label": "Mar 2026",
            "size": 455,
            "retention": [
              100,
              72,
              55,
              46,
              41,
              38
            ]
          },
          {
            "label": "Apr 2026",
            "size": 497,
            "retention": [
              100,
              73,
              58,
              49,
              44
            ]
          },
          {
            "label": "May 2026",
            "size": 521,
            "retention": [
              100,
              75,
              60,
              52
            ]
          },
          {
            "label": "Jun 2026",
            "size": 560,
            "retention": [
              100,
              77,
              63
            ]
          },
          {
            "label": "Jul 2026",
            "size": 604,
            "retention": [
              100,
              78
            ]
          },
          {
            "label": "Aug 2026",
            "size": 648,
            "retention": [
              100
            ]
          }
        ],
        "periodLabel": "M",
        "periodName": "Month",
        "palette": "accent",
        "reveal": "rows",
        "showValues": true
      }
    }
  }
}