Vergleich
Live-Ausgabe der echten Render-Engine — ändere die Einstellungen und sie aktualisiert sich sofort.
Bullet-Charts
gestaltete motion-karten
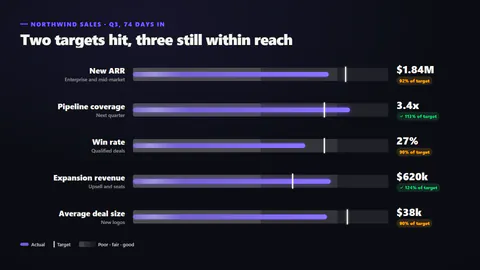
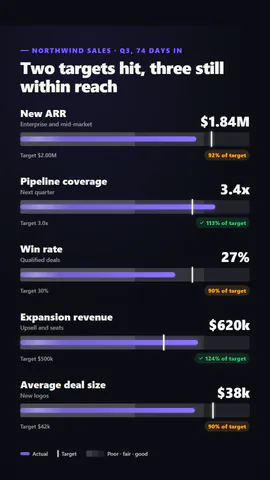
Bullet-Charts, die jede Kennzahl durch schwache, mittlere und gute Bereiche auf eine Ziellinie zuwachsen lassen, mit einem Prozent-vom-Ziel-Badge.
Ideal für: Vertriebsziele, Quartalsziele und Fortschritt gegenüber dem Plan.
Einstellungen
Schrift
Theme
Größe
Stimmung
Formate, die die Bildprüfung bestanden haben
1:1
Was du schreibst
titleTitle (≤60)· PflichtitemsEach measure with its value, target and the end of its scale· PflichtkickerSmall line above the title (≤40)poorBelowThe poor range ends at this percent of the scale (≤100)goodAboveThe good range starts at this percent of the scale (≤100)bandsShades: grey ranges, the classic look; status: red, amber and green rangeslayoutRows: horizontal bullets stacked; columns: vertical bullets side by side
Eine Code-Vorlage: in jedem Tarif kostenlos, ohne KI-Credits.
In einem Film verwenden
Was du ändern kannst:
rushie.props.titlerushie.props.itemsrushie.props (others)Für Entwickler (MCP und JSON)
Das ist genau die Szene für create_animation (MCP): Struktur behalten, Worte ändern und den Sprechertext schreiben — die Stimme bestimmt, wie lange die Szene dauert. Mit set_data in update_storyboard einfügen, um einen fertigen Film zu ändern.
{
  "visual": "rushie",
  "heading": "Bullet charts",
  "narration": "Write the sentence the voice says over this scene; its length is the scene's.",
  "data": {
    "rushie": {
      "template": "bullet-charts",
      "props": {
        "kicker": "Northwind sales · Q3, 74 days in",
        "title": "Two targets hit, three still within reach",
        "items": [
          {
            "label": "New ARR",
            "note": "Enterprise and mid-market",
            "value": 1.84,
            "target": 2,
            "max": 2.4,
            "prefix": "$",
            "suffix": "M",
            "decimals": 2
          },
          {
            "label": "Pipeline coverage",
            "note": "Next quarter",
            "value": 3.4,
            "target": 3,
            "max": 4,
            "prefix": "",
            "suffix": "x",
            "decimals": 1
          },
          {
            "label": "Win rate",
            "note": "Qualified deals",
            "value": 27,
            "target": 30,
            "max": 40,
            "prefix": "",
            "suffix": "%",
            "decimals": 0
          },
          {
            "label": "Expansion revenue",
            "note": "Upsell and seats",
            "value": 620,
            "target": 500,
            "max": 800,
            "prefix": "$",
            "suffix": "k",
            "decimals": 0
          },
          {
            "label": "Average deal size",
            "note": "New logos",
            "value": 38,
            "target": 42,
            "max": 50,
            "prefix": "$",
            "suffix": "k",
            "decimals": 0
          }
        ],
        "poorBelow": 50,
        "goodAbove": 80,
        "bands": "shades",
        "layout": "rows"
      }
    }
  }
}