Données et ROI
Sortie en direct du vrai moteur de rendu — modifiez les réglages et elle se met à jour instantanément.
Prévision avec intervalle
cartes animées design
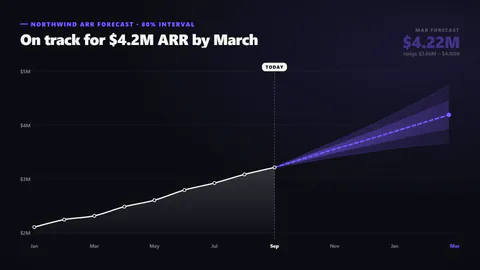
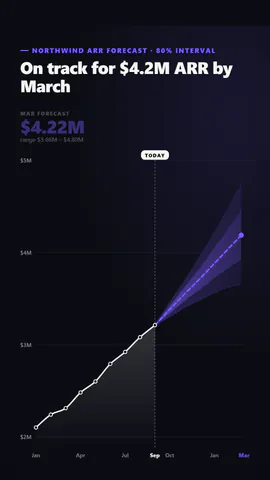
Une courbe de réalisations se trace jusqu'à un repère Today, puis se prolonge en prévision en pointillés dans une bande de confiance qui s'élargit avec le temps, pour finir sur le chiffre prévu et sa fourchette.
Idéal pour : prévisions de revenus, projections et planification.
Réglages
Police
Thème
Taille
Humeur
Formats validés par le contrôle d'image
1:1
Ce que vous écrivez
titleTitle (≤60)· obligatoireactualsWhat actually happened, in order· obligatoireforecastThe forecast after the last actual: the expected value and the low and high ends of its range· obligatoirekickerSmall line above the title (≤40)prefixBefore each value, like $ (≤3)suffixAfter each value, like M or % (≤4)decimalsDecimal places (≤2)todayLabelThe tag on the line between actuals and forecast (≤14)bandFan: an inner likely band inside the full range; single: one bandcurveSmooth curves or straight segments
Un modèle en code : gratuit sur toutes les offres, sans crédits IA.
L'utiliser dans un film
Ce que vous pouvez changer :
rushie.props.titlerushie.props.actualsrushie.props.forecastrushie.props (others)Pour les développeurs (MCP et JSON)
Voici la scène exacte à envoyer à create_animation (MCP) : gardez la structure, changez les mots et écrivez la narration — c'est la voix qui fixe la durée de la scène. Collez-la dans update_storyboard avec set_data pour modifier un film déjà fait.
{
  "visual": "rushie",
  "heading": "Forecast with confidence band",
  "narration": "Write the sentence the voice says over this scene; its length is the scene's.",
  "data": {
    "rushie": {
      "template": "forecast-band",
      "props": {
        "kicker": "Northwind ARR forecast · 80% interval",
        "title": "On track for $4.2M ARR by March",
        "actuals": [
          {
            "label": "Jan",
            "value": 2.1
          },
          {
            "label": "Feb",
            "value": 2.24
          },
          {
            "label": "Mar",
            "value": 2.31
          },
          {
            "label": "Apr",
            "value": 2.48
          },
          {
            "label": "May",
            "value": 2.6
          },
          {
            "label": "Jun",
            "value": 2.79
          },
          {
            "label": "Jul",
            "value": 2.92
          },
          {
            "label": "Aug",
            "value": 3.08
          },
          {
            "label": "Sep",
            "value": 3.21
          }
        ],
        "forecast": [
          {
            "label": "Oct",
            "value": 3.38,
            "low": 3.3,
            "high": 3.46
          },
          {
            "label": "Nov",
            "value": 3.55,
            "low": 3.4,
            "high": 3.7
          },
          {
            "label": "Dec",
            "value": 3.71,
            "low": 3.48,
            "high": 3.95
          },
          {
            "label": "Jan",
            "value": 3.88,
            "low": 3.56,
            "high": 4.22
          },
          {
            "label": "Feb",
            "value": 4.05,
            "low": 3.62,
            "high": 4.5
          },
          {
            "label": "Mar",
            "value": 4.22,
            "low": 3.66,
            "high": 4.8
          }
        ],
        "prefix": "$",
        "suffix": "M",
        "decimals": 2,
        "todayLabel": "Today",
        "band": "fan",
        "curve": "smooth"
      }
    }
  }
}