Données et ROI
Sortie en direct du vrai moteur de rendu — modifiez les réglages et elle se met à jour instantanément.
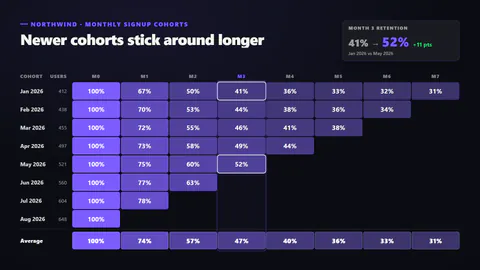
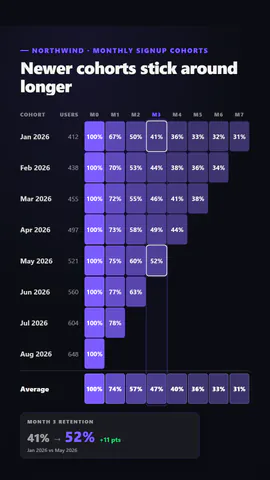
Rétention par cohorte
cartes animées design
Un triangle de rétention par cohorte qui se colorie ligne par ligne (ou période par période), chaque case affichant son pourcentage, avec une ligne de moyenne et une bulle comparant anciennes et nouvelles cohortes.
Idéal pour : revues de rétention, product-market fit et points de croissance.
Réglages
Police
Thème
Taille
Humeur
Formats validés par le contrôle d'image
1:1
Ce que vous écrivez
titleTitle (≤60)· obligatoirecohortsCohorts from oldest to newest, each with its size and retention by period· obligatoireperiodNameThe period in words, for the callout (≤10)· obligatoirekickerSmall line above the title (≤40)periodLabelShort prefix for the period columns, like M or W (≤3)paletteAccent: deeper accent for higher retention; heat: red to amber to greenrevealRows: each cohort colours in turn; columns: period by period down the tableshowValuesPrint the percentage in each cell
Un modèle en code : gratuit sur toutes les offres, sans crédits IA.
L'utiliser dans un film
Idéal pourChiffres & résultats
Ce que vous pouvez changer :
rushie.props.titlerushie.props.cohortsrushie.props.periodNamerushie.props (others)Pour les développeurs (MCP et JSON)
Voici la scène exacte à envoyer à create_animation (MCP) : gardez la structure, changez les mots et écrivez la narration — c'est la voix qui fixe la durée de la scène. Collez-la dans update_storyboard avec set_data pour modifier un film déjà fait.
{
  "visual": "rushie",
  "heading": "Cohort retention",
  "narration": "Write the sentence the voice says over this scene; its length is the scene's.",
  "data": {
    "rushie": {
      "template": "cohort-retention",
      "props": {
        "kicker": "Northwind · monthly signup cohorts",
        "title": "Newer cohorts stick around longer",
        "cohorts": [
          {
            "label": "Jan 2026",
            "size": 412,
            "retention": [
              100,
              67,
              50,
              41,
              36,
              33,
              32,
              31
            ]
          },
          {
            "label": "Feb 2026",
            "size": 438,
            "retention": [
              100,
              70,
              53,
              44,
              38,
              36,
              34
            ]
          },
          {
            "label": "Mar 2026",
            "size": 455,
            "retention": [
              100,
              72,
              55,
              46,
              41,
              38
            ]
          },
          {
            "label": "Apr 2026",
            "size": 497,
            "retention": [
              100,
              73,
              58,
              49,
              44
            ]
          },
          {
            "label": "May 2026",
            "size": 521,
            "retention": [
              100,
              75,
              60,
              52
            ]
          },
          {
            "label": "Jun 2026",
            "size": 560,
            "retention": [
              100,
              77,
              63
            ]
          },
          {
            "label": "Jul 2026",
            "size": 604,
            "retention": [
              100,
              78
            ]
          },
          {
            "label": "Aug 2026",
            "size": 648,
            "retention": [
              100
            ]
          }
        ],
        "periodLabel": "M",
        "periodName": "Month",
        "palette": "accent",
        "reveal": "rows",
        "showValues": true
      }
    }
  }
}